PyTorch Geometric
2 minute read
PyTorch Geometric 또는 PyG는 기하 딥러닝을 위한 가장 인기 있는 라이브러리 중 하나이며, W&B는 그래프 시각화 및 experiments 추적을 위해 이 라이브러리와 매우 잘 연동됩니다.
Pytorch Geometric을 설치한 후 다음 단계에 따라 시작하세요.
가입 및 API 키 생성
API 키는 사용자의 머신을 W&B에 인증합니다. 사용자 프로필에서 API 키를 생성할 수 있습니다.
- 오른쪽 상단 모서리에 있는 사용자 프로필 아이콘을 클릭합니다.
- User Settings를 선택한 다음 API Keys 섹션으로 스크롤합니다.
- Reveal을 클릭합니다. 표시된 API 키를 복사합니다. API 키를 숨기려면 페이지를 새로 고침하세요.
wandb 라이브러리 설치 및 로그인
wandb 라이브러리를 로컬에 설치하고 로그인하려면 다음을 수행합니다.
-
WANDB_API_KEY환경 변수를 API 키로 설정합니다.export WANDB_API_KEY=<your_api_key> -
wandb라이브러리를 설치하고 로그인합니다.pip install wandb wandb login
pip install wandb
import wandb
wandb.login()
!pip install wandb

import wandb
wandb.login()
그래프 시각화
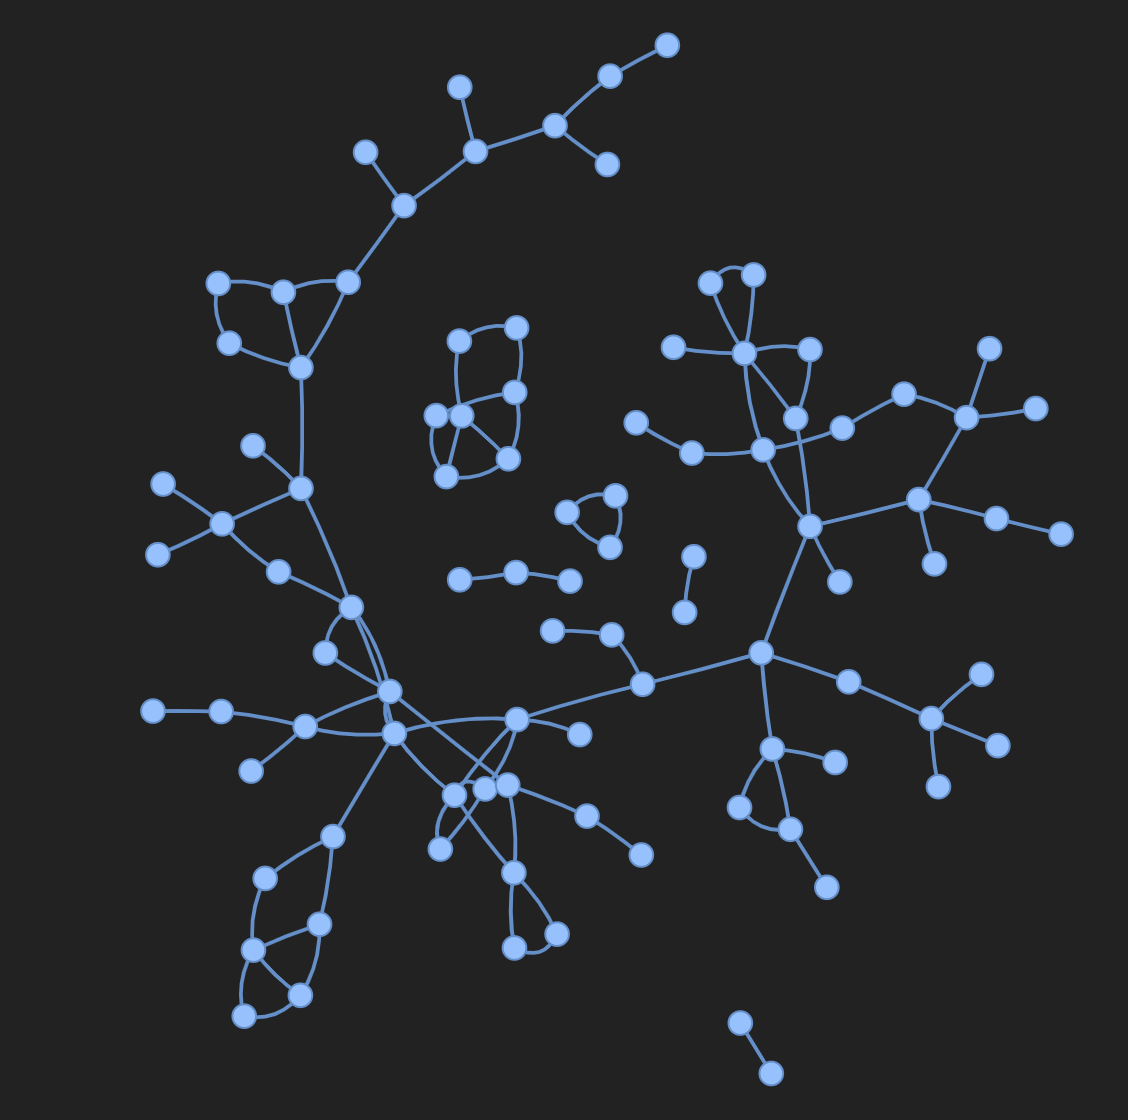
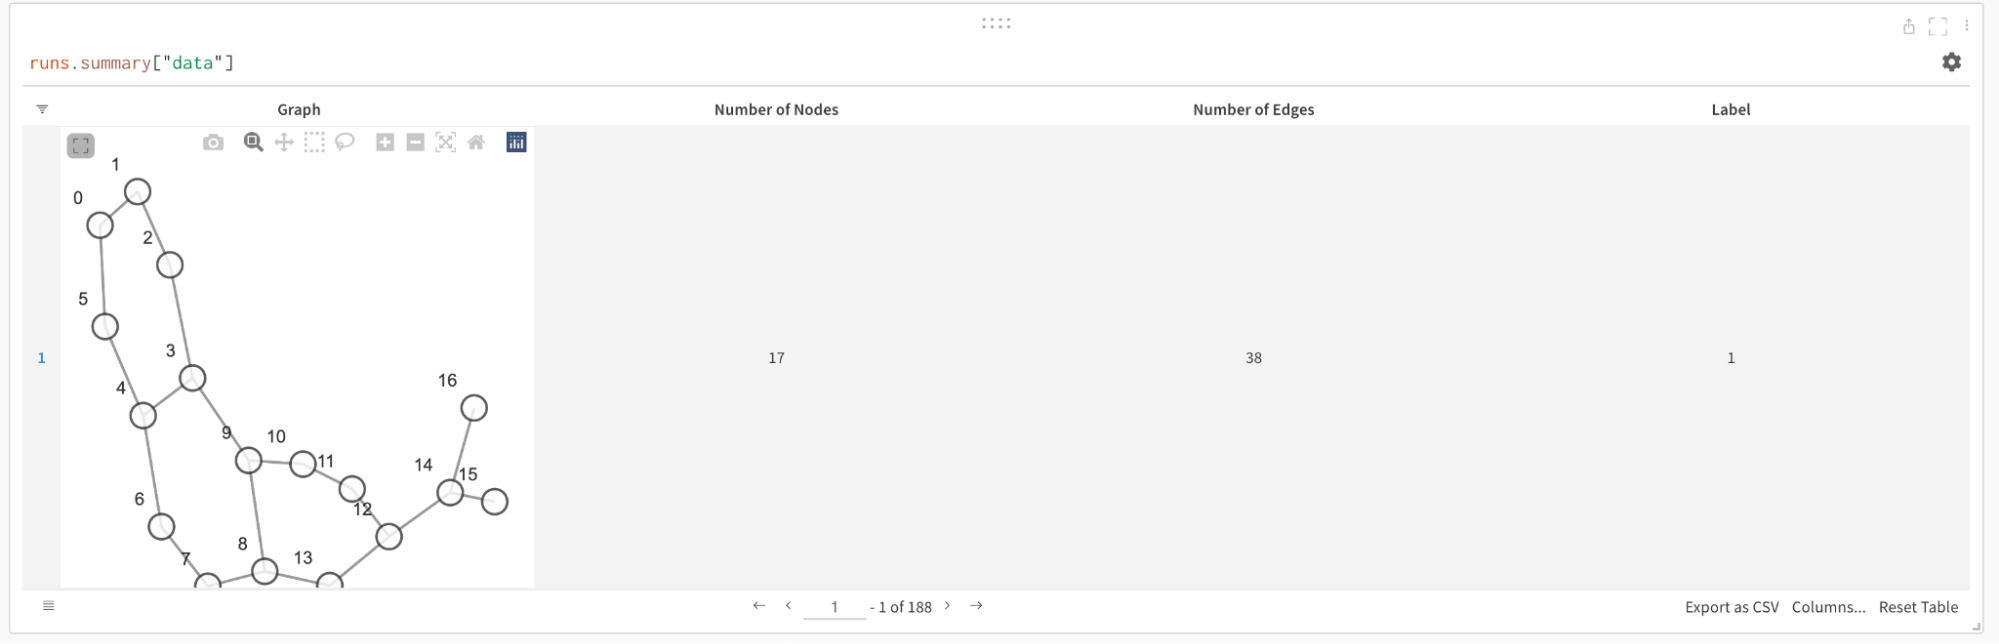
엣지 수, 노드 수 등 입력 그래프에 대한 세부 정보를 저장할 수 있습니다. W&B는 Plotly 차트 및 HTML 패널 로깅을 지원하므로 그래프에 대해 생성하는 모든 시각화를 W&B에 로깅할 수도 있습니다.
PyVis 사용
다음 스니펫은 PyVis 및 HTML을 사용하여 이를 수행하는 방법을 보여줍니다.
from pyvis.network import Network
Import wandb

wandb.init(project=’graph_vis’)
net = Network(height="750px", width="100%", bgcolor="#222222", font_color="white")

# Add the edges from the PyG graph to the PyVis network
for e in tqdm(g.edge_index.T):
    src = e[0].item()
    dst = e[1].item()

    net.add_node(dst)
    net.add_node(src)

    net.add_edge(src, dst, value=0.1)

# Save the PyVis visualisation to a HTML file
net.show("graph.html")
wandb.log({"eda/graph": wandb.Html("graph.html")})
wandb.finish()
Plotly 사용
Plotly를 사용하여 그래프 시각화를 만들려면 먼저 PyG 그래프를 networkx 오브젝트로 변환해야 합니다. 다음으로 노드와 엣지 모두에 대해 Plotly 산점도를 만들어야 합니다. 아래 스니펫을 이 작업에 사용할 수 있습니다.
def create_vis(graph):
    G = to_networkx(graph)
    pos = nx.spring_layout(G)

    edge_x = []
    edge_y = []
    for edge in G.edges():
        x0, y0 = pos[edge[0]]
        x1, y1 = pos[edge[1]]
        edge_x.append(x0)
        edge_x.append(x1)
        edge_x.append(None)
        edge_y.append(y0)
        edge_y.append(y1)
        edge_y.append(None)

    edge_trace = go.Scatter(
        x=edge_x, y=edge_y,
        line=dict(width=0.5, color='#888'),
        hoverinfo='none',
        mode='lines'
    )

    node_x = []
    node_y = []
    for node in G.nodes():
        x, y = pos[node]
        node_x.append(x)
        node_y.append(y)

    node_trace = go.Scatter(
        x=node_x, y=node_y,
        mode='markers',
        hoverinfo='text',
        line_width=2
    )

    fig = go.Figure(data=[edge_trace, node_trace], layout=go.Layout())

    return fig


wandb.init(project=’visualize_graph’)
wandb.log({‘graph’: wandb.Plotly(create_vis(graph))})
wandb.finish()
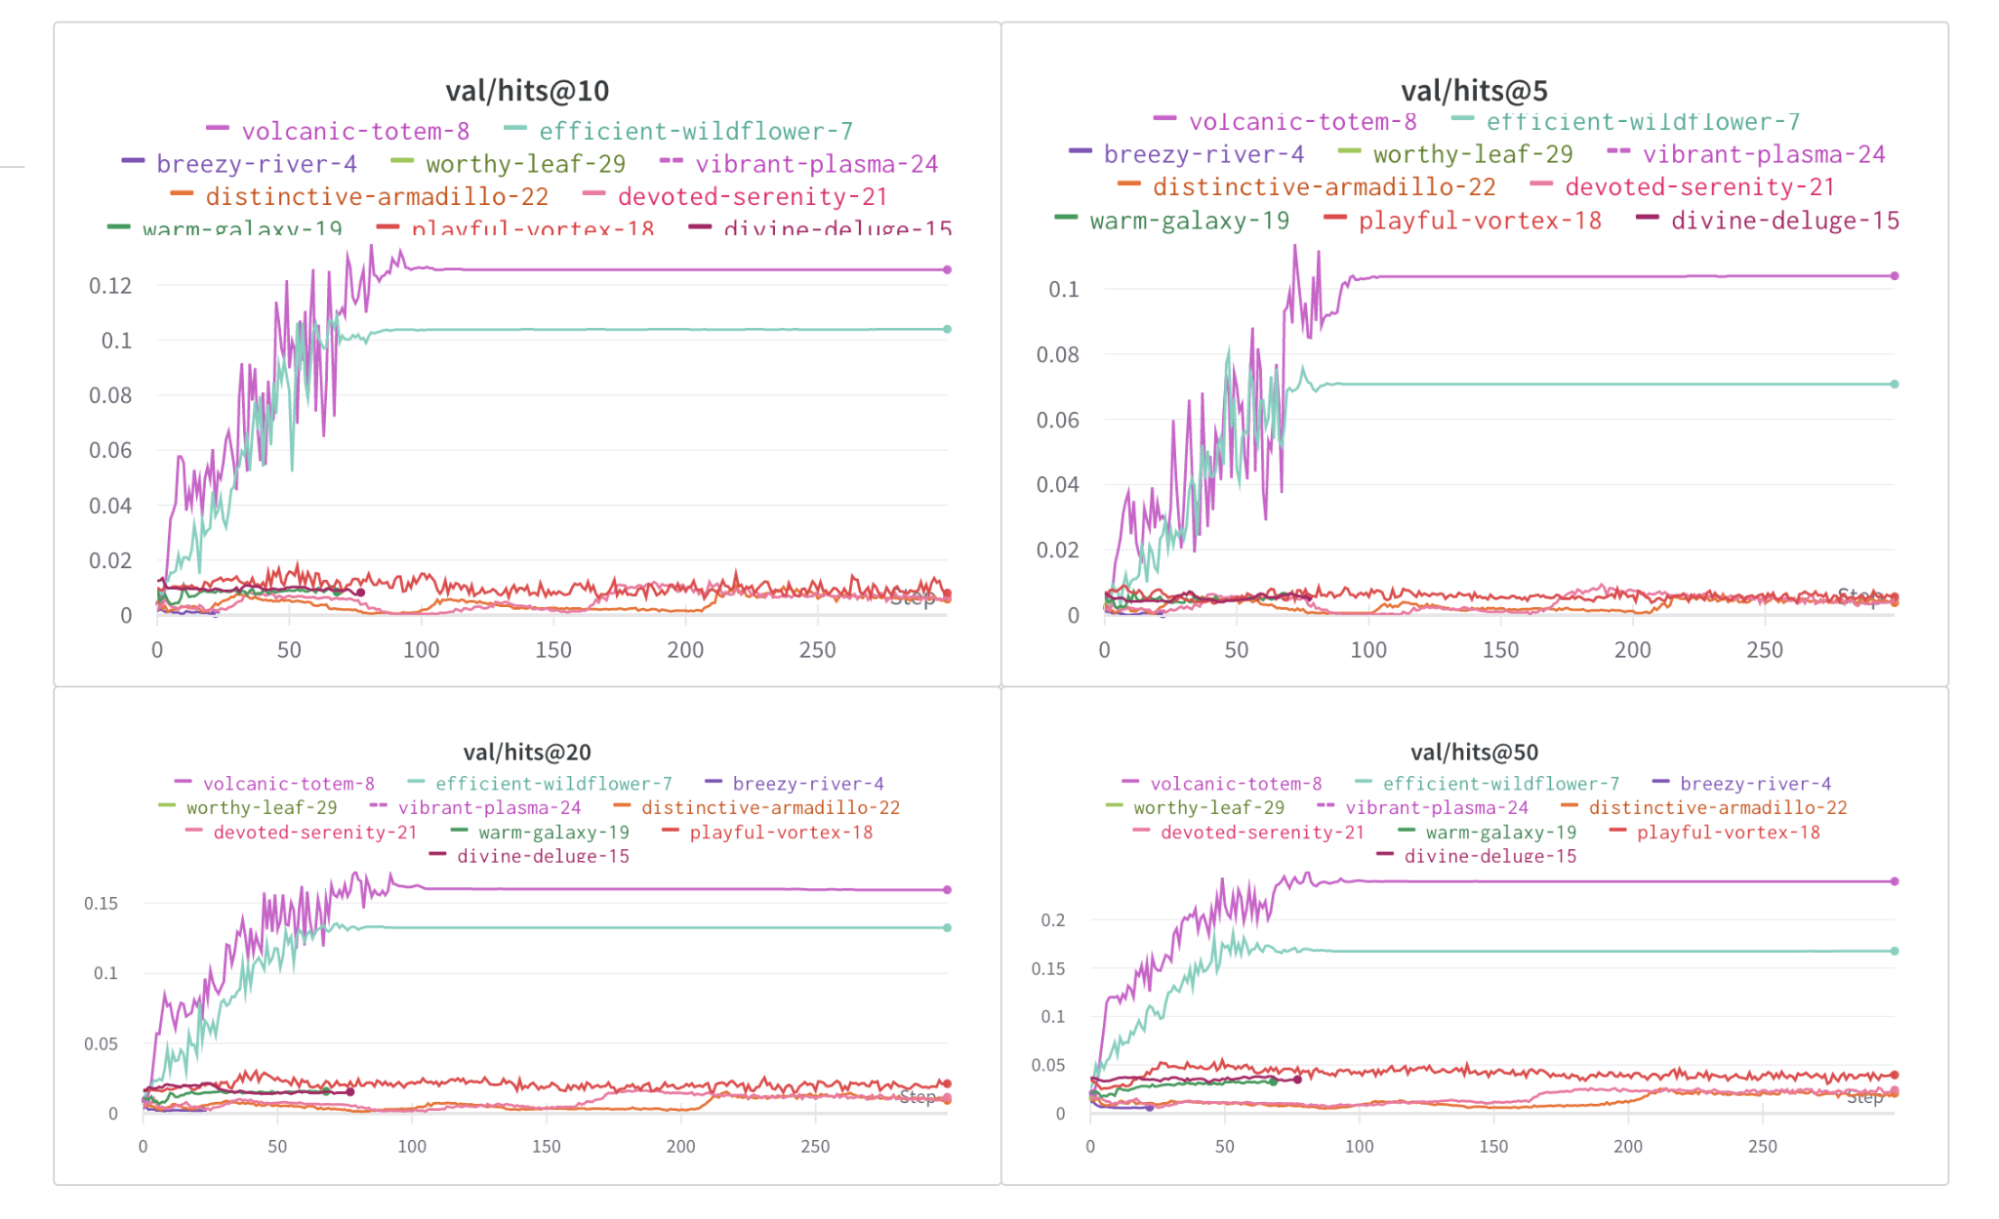
메트릭 기록
W&B를 사용하여 experiments 및 관련 메트릭(예: 손실 함수, 정확도 등)을 추적할 수 있습니다. 다음 줄을 트레이닝 루프에 추가합니다.
wandb.log({
	‘train/loss’: training_loss,
	‘train/acc’: training_acc,
	‘val/loss’: validation_loss,
	‘val/acc’: validation_acc
})
추가 자료
- PyTorch Geometric에서 그래프 신경망을 사용하여 Amazon 제품 추천
- PyTorch Geometric을 사용한 포인트 클라우드 분류
- PyTorch Geometric을 사용한 포인트 클라우드 분할
Feedback
Was this page helpful?
Glad to hear it! Please tell us how we can improve.
Sorry to hear that. Please tell us how we can improve.