Track CSV files with experiments
4 minute read
W&B Python Library を使用して CSV ファイルをログに記録し、W&B Dashboard で可視化します。 W&B Dashboard は、機械学習モデルの結果を整理して可視化するための中央の場所です。これは、W&B にログ記録されていない以前の機械学習実験の情報を含む CSV ファイルがある場合、またはデータセットを含む CSV ファイルがある場合に特に役立ちます。
データセットのCSVファイルをインポートしてログに記録する
CSV ファイルの内容を再利用しやすくするために、W&B Artifacts を利用することをお勧めします。
- まず、CSV ファイルをインポートします。次のコードスニペットで、
iris.csvファイル名を CSV ファイルの名前に置き換えます。
import wandb
import pandas as pd

# Read our CSV into a new DataFrame
new_iris_dataframe = pd.read_csv("iris.csv")
- CSV ファイルを W&B テーブルに変換して、W&B Dashboards を利用します。
# Convert the DataFrame into a W&B Table
iris_table = wandb.Table(dataframe=new_iris_dataframe)
- 次に、W&B Artifact を作成し、テーブルを Artifact に追加します。
# Add the table to an Artifact to increase the row
# limit to 200000 and make it easier to reuse
iris_table_artifact = wandb.Artifact("iris_artifact", type="dataset")
iris_table_artifact.add(iris_table, "iris_table")

# Log the raw csv file within an artifact to preserve our data
iris_table_artifact.add_file("iris.csv")
W&B Artifacts の詳細については、Artifacts のチャプター を参照してください。
- 最後に、
wandb.initで W&B Run を開始し、W&B に追跡およびログを記録します。
# Start a W&B run to log data
run = wandb.init(project="tables-walkthrough")

# Log the table to visualize with a run...
run.log({"iris": iris_table})

# and Log as an Artifact to increase the available row limit!
run.log_artifact(iris_table_artifact)
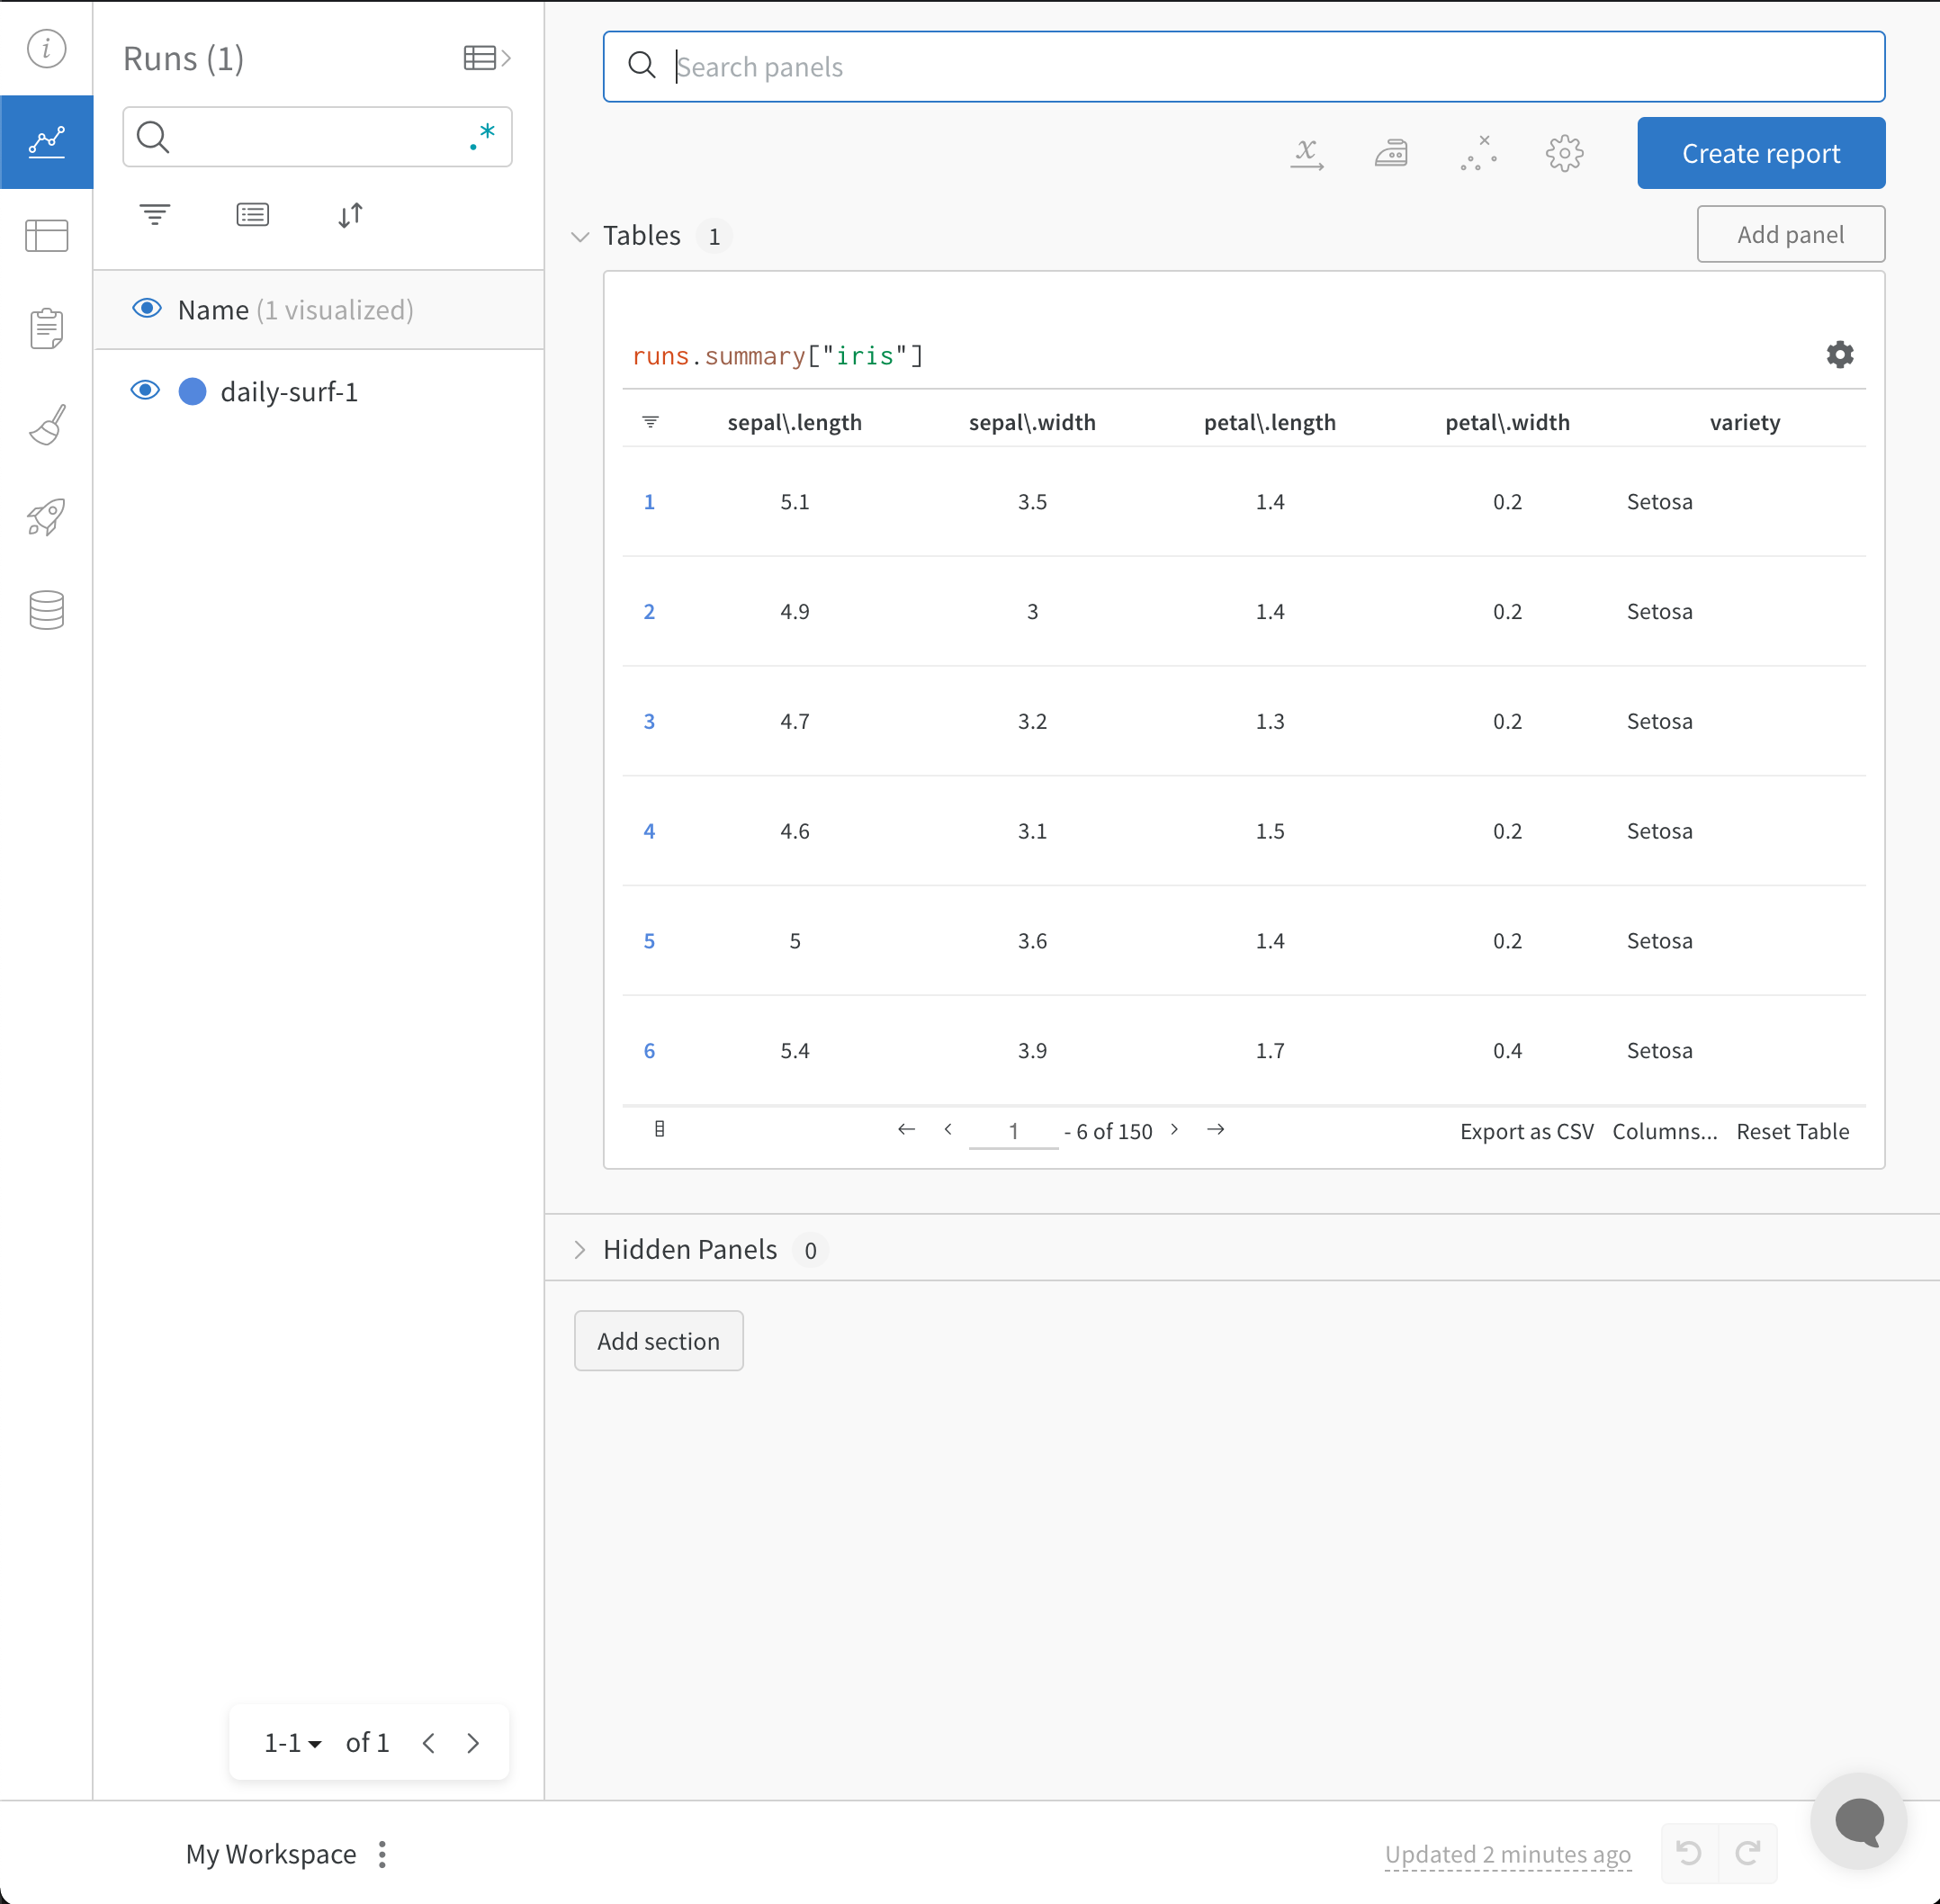
wandb.init() API は、Run にデータをログ記録するための新しいバックグラウンド プロセスを生成し、(デフォルトで) データを wandb.ai に同期します。 W&B Workspace Dashboard でライブ可視化を表示します。次の画像は、コードスニペットのデモの出力を示しています。
上記のコードスニペットを含む完全なスクリプトは、以下にあります。
import wandb
import pandas as pd

# Read our CSV into a new DataFrame
new_iris_dataframe = pd.read_csv("iris.csv")

# Convert the DataFrame into a W&B Table
iris_table = wandb.Table(dataframe=new_iris_dataframe)

# Add the table to an Artifact to increase the row
# limit to 200000 and make it easier to reuse
iris_table_artifact = wandb.Artifact("iris_artifact", type="dataset")
iris_table_artifact.add(iris_table, "iris_table")

# log the raw csv file within an artifact to preserve our data
iris_table_artifact.add_file("iris.csv")

# Start a W&B run to log data
run = wandb.init(project="tables-walkthrough")

# Log the table to visualize with a run...
run.log({"iris": iris_table})

# and Log as an Artifact to increase the available row limit!
run.log_artifact(iris_table_artifact)

# Finish the run (useful in notebooks)
run.finish()
Experiments の CSV ファイルをインポートしてログに記録する
場合によっては、CSV ファイルに experiment の詳細が含まれている場合があります。このような CSV ファイルにある一般的な詳細は次のとおりです。
- experiment run の名前
- 最初のノート
- experiment を区別するためのタグ
- experiment に必要な設定 (当社の Sweeps Hyperparameter Tuningを利用できるという追加の利点があります)。
| Experiment | Model Name | Notes | Tags | Num Layers | Final Train Acc | Final Val Acc | Training Losses |
|---|---|---|---|---|---|---|---|
| Experiment 1 | mnist-300-layers | Overfit way too much on training data | [latest] | 300 | 0.99 | 0.90 | [0.55, 0.45, 0.44, 0.42, 0.40, 0.39] |
| Experiment 2 | mnist-250-layers | Current best model | [prod, best] | 250 | 0.95 | 0.96 | [0.55, 0.45, 0.44, 0.42, 0.40, 0.39] |
| Experiment 3 | mnist-200-layers | Did worse than the baseline model. Need to debug | [debug] | 200 | 0.76 | 0.70 | [0.55, 0.45, 0.44, 0.42, 0.40, 0.39] |
| … | … | … | … | … | … | … | |
| Experiment N | mnist-X-layers | NOTES | … | … | … | … | […, …] |
W&B は、experiments の CSV ファイルを取得し、W&B Experiment Run に変換できます。次のコードスニペットとコードスクリプトは、experiments の CSV ファイルをインポートしてログに記録する方法を示しています。
- まず、CSV ファイルを読み込み、Pandas DataFrame に変換します。
experiments.csvを CSV ファイルの名前に置き換えます。
import wandb
import pandas as pd

FILENAME = "experiments.csv"
loaded_experiment_df = pd.read_csv(FILENAME)

PROJECT_NAME = "Converted Experiments"

EXPERIMENT_NAME_COL = "Experiment"
NOTES_COL = "Notes"
TAGS_COL = "Tags"
CONFIG_COLS = ["Num Layers"]
SUMMARY_COLS = ["Final Train Acc", "Final Val Acc"]
METRIC_COLS = ["Training Losses"]

# Format Pandas DataFrame to make it easier to work with
for i, row in loaded_experiment_df.iterrows():
    run_name = row[EXPERIMENT_NAME_COL]
    notes = row[NOTES_COL]
    tags = row[TAGS_COL]

    config = {}
    for config_col in CONFIG_COLS:
        config[config_col] = row[config_col]

    metrics = {}
    for metric_col in METRIC_COLS:
        metrics[metric_col] = row[metric_col]

    summaries = {}
    for summary_col in SUMMARY_COLS:
        summaries[summary_col] = row[summary_col]
- 次に、
wandb.init()で W&B Run を開始し、W&B に追跡およびログを記録します。
run = wandb.init(
    project=PROJECT_NAME, name=run_name, tags=tags, notes=notes, config=config
)
experiment の実行中に、W&B で表示、クエリ、および分析できるように、メトリクスのすべてのインスタンスをログに記録することができます。これを行うには、run.log() コマンドを使用します。
run.log({key: val})
オプションで、run の結果を定義するために、最終的なサマリーメトリクスをログに記録できます。これを行うには、W&B define_metric API を使用します。この例では、run.summary.update() を使用して、サマリーメトリクスを run に追加します。
run.summary.update(summaries)
サマリーメトリクスの詳細については、サマリーメトリクスのログ記録 を参照してください。
以下は、上記のサンプルテーブルを W&B Dashboard に変換する完全なスクリプトの例です。
FILENAME = "experiments.csv"
loaded_experiment_df = pd.read_csv(FILENAME)

PROJECT_NAME = "Converted Experiments"

EXPERIMENT_NAME_COL = "Experiment"
NOTES_COL = "Notes"
TAGS_COL = "Tags"
CONFIG_COLS = ["Num Layers"]
SUMMARY_COLS = ["Final Train Acc", "Final Val Acc"]
METRIC_COLS = ["Training Losses"]

for i, row in loaded_experiment_df.iterrows():
    run_name = row[EXPERIMENT_NAME_COL]
    notes = row[NOTES_COL]
    tags = row[TAGS_COL]

    config = {}
    for config_col in CONFIG_COLS:
        config[config_col] = row[config_col]

    metrics = {}
    for metric_col in METRIC_COLS:
        metrics[metric_col] = row[metric_col]

    summaries = {}
    for summary_col in SUMMARY_COLS:
        summaries[summary_col] = row[summary_col]

    run = wandb.init(
        project=PROJECT_NAME, name=run_name, tags=tags, notes=notes, config=config
    )

    for key, val in metrics.items():
        if isinstance(val, list):
            for _val in val:
                run.log({key: _val})
        else:
            run.log({key: val})

    run.summary.update(summaries)
    run.finish()
[i18n] feedback_title
[i18n] feedback_question
Glad to hear it! Please tell us how we can improve.
Sorry to hear that. Please tell us how we can improve.