PyTorch
2 minute read
PyTorch는 Python에서 딥러닝을 위한 가장 인기 있는 프레임워크 중 하나이며, 특히 연구자들 사이에서 인기가 높습니다. W&B는 gradient 로깅부터 CPU 및 GPU에서 코드 프로파일링에 이르기까지 PyTorch에 대한 최고의 지원을 제공합니다.
Colab 노트북에서 W&B 인테그레이션을 사용해 보세요.
예제 레포에서 스크립트를 볼 수도 있습니다. 여기에는 Fashion MNIST에서 Hyperband를 사용하여 하이퍼파라미터 최적화에 대한 스크립트와 생성된 W&B 대시보드가 포함되어 있습니다.
wandb.watch로 gradient 로그
gradient를 자동으로 기록하려면 wandb.watch를 호출하고 PyTorch model을 전달하면 됩니다.
import wandb

wandb.init(config=args)

model = ...  # set up your model

# Magic
wandb.watch(model, log_freq=100)

model.train()
for batch_idx, (data, target) in enumerate(train_loader):
    output = model(data)
    loss = F.nll_loss(output, target)
    loss.backward()
    optimizer.step()
    if batch_idx % args.log_interval == 0:
        wandb.log({"loss": loss})
동일한 스크립트에서 여러 model을 추적해야 하는 경우 각 model에서 wandb.watch를 개별적으로 호출할 수 있습니다. 이 함수에 대한 참조 문서는 여기에 있습니다.
wandb.log가 호출될 때까지 기록되지 않습니다.이미지 및 미디어 로그
이미지 데이터가 포함된 PyTorch Tensors를 wandb.Image로 전달할 수 있으며, torchvision의 유틸리티가 자동으로 이미지를 변환하는 데 사용됩니다.
images_t = ...  # generate or load images as PyTorch Tensors
wandb.log({"examples": [wandb.Image(im) for im in images_t]})
PyTorch 및 기타 프레임워크에서 W&B에 rich media를 로깅하는 방법에 대한 자세한 내용은 미디어 로깅 가이드를 확인하세요.
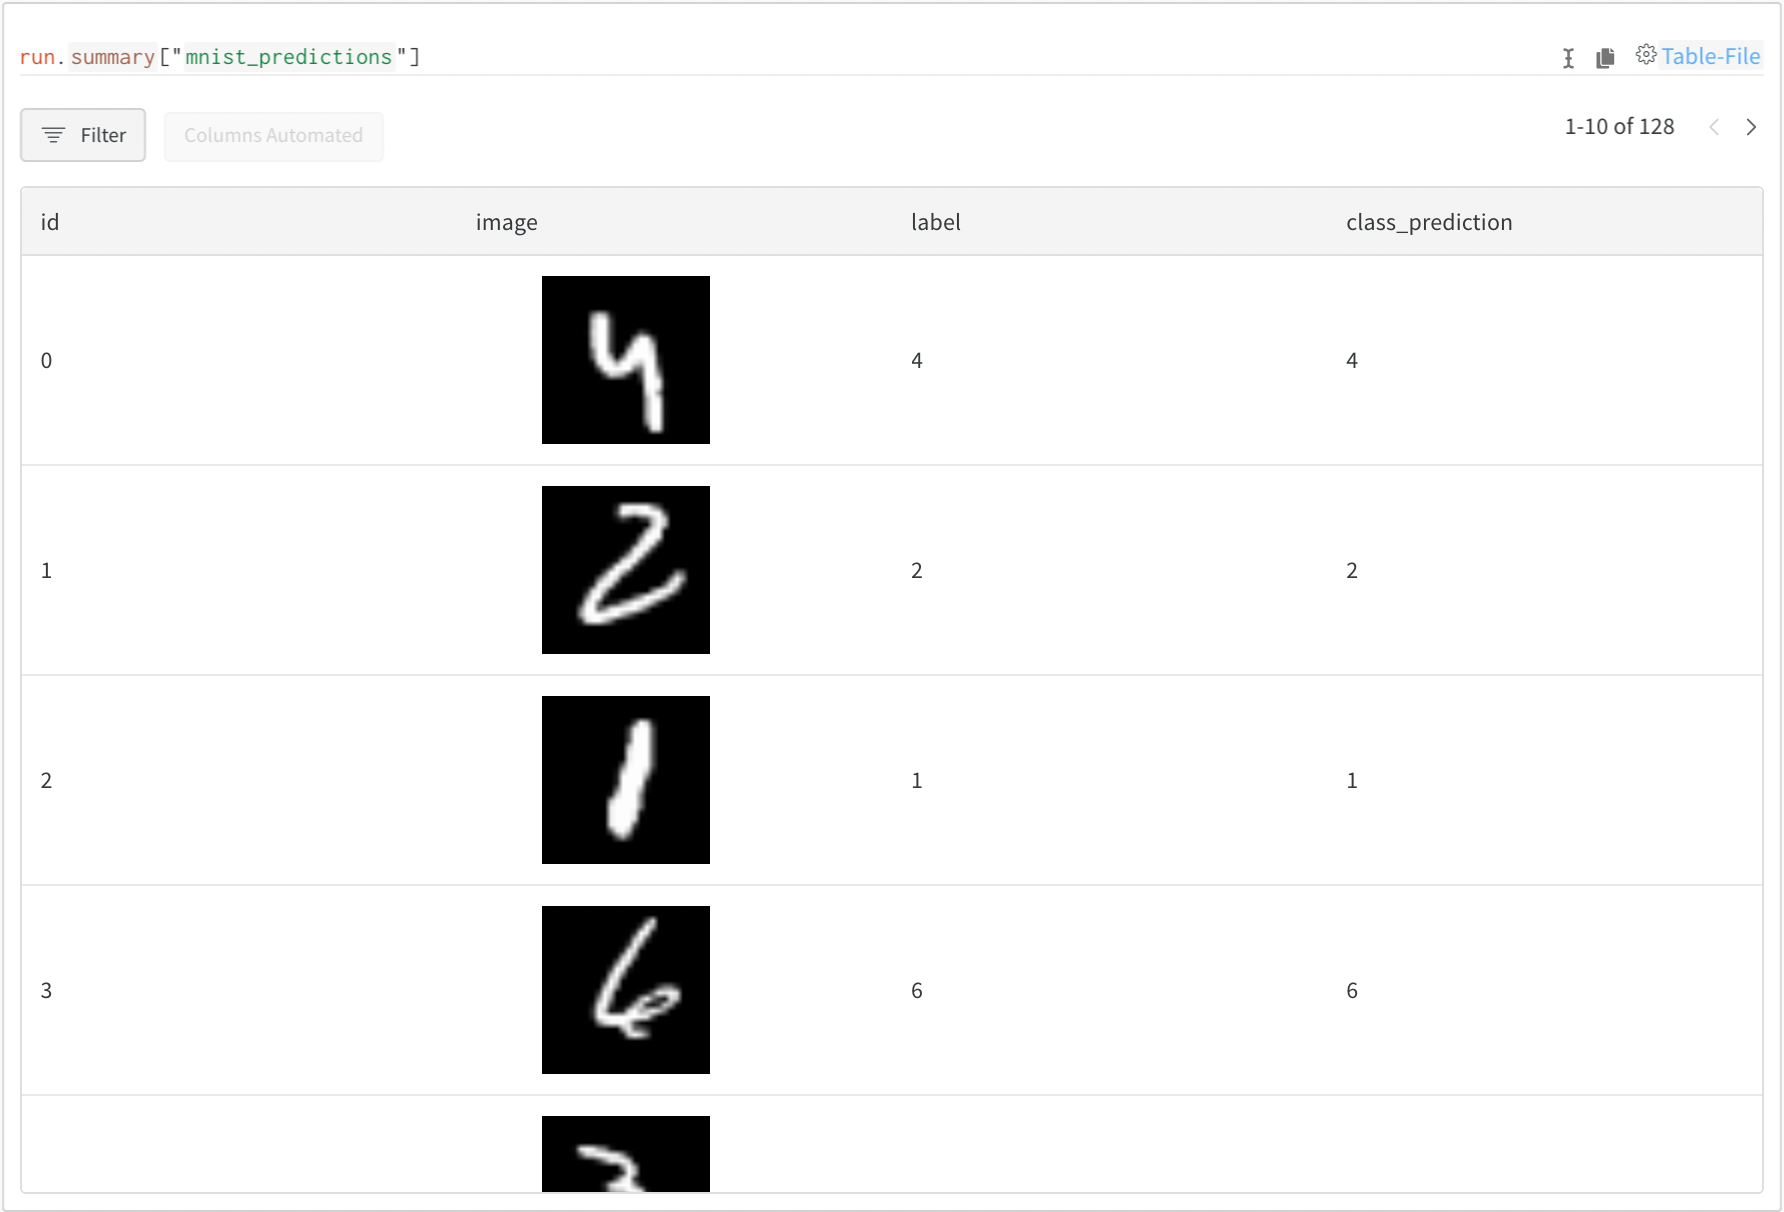
model의 예측 또는 파생 메트릭과 같은 정보를 미디어와 함께 포함하려면 wandb.Table을 사용하세요.
my_table = wandb.Table()

my_table.add_column("image", images_t)
my_table.add_column("label", labels)
my_table.add_column("class_prediction", predictions_t)

# Log your Table to W&B
wandb.log({"mnist_predictions": my_table})
데이터셋 및 model 로깅 및 시각화에 대한 자세한 내용은 W&B Tables 가이드를 확인하세요.
PyTorch 코드 프로파일링
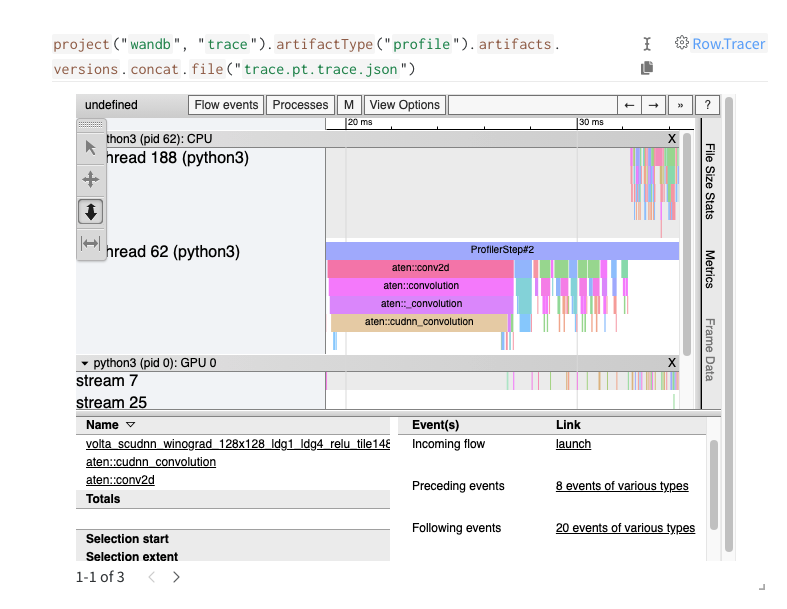
W&B는 PyTorch Kineto의 Tensorboard plugin과 직접 통합되어 PyTorch 코드 프로파일링, CPU 및 GPU 통신 세부 정보 검사, 병목 현상 및 최적화 식별을 위한 툴을 제공합니다.
profile_dir = "path/to/run/tbprofile/"
profiler = torch.profiler.profile(
    schedule=schedule,  # see the profiler docs for details on scheduling
    on_trace_ready=torch.profiler.tensorboard_trace_handler(profile_dir),
    with_stack=True,
)

with profiler:
    ...  # run the code you want to profile here
    # see the profiler docs for detailed usage information

# create a wandb Artifact
profile_art = wandb.Artifact("trace", type="profile")
# add the pt.trace.json files to the Artifact
profile_art.add_file(glob.glob(profile_dir + ".pt.trace.json"))
# log the artifact
profile_art.save()
이 Colab에서 작업 예제 코드를 보고 실행하세요.
[i18n] feedback_title
[i18n] feedback_question
Glad to hear it! Please tell us how we can improve.
Sorry to hear that. Please tell us how we can improve.